After two decades in SEO, I’ve watched countless “game-changing” metrics come and go. But Core Web Vitals are different. They’re not just another technical checkbox—they’re Google’s way of forcing us to care about what users actually experience when they visit our sites.
Here’s the reality: only 21.98% of websites meet all Core Web Vitals thresholds. That means if you can nail these metrics, you’re already ahead of nearly 80% of your competition. Let me show you exactly how to get there.
What Are Core Web Vitals (And Why They Actually Matter)
Core Web Vitals measure three critical aspects of user experience: how fast your page loads, how quickly it responds to interactions, and whether elements jump around while loading. These aren’t abstract technical concepts—they directly impact whether users stay on your site or hit the back button.
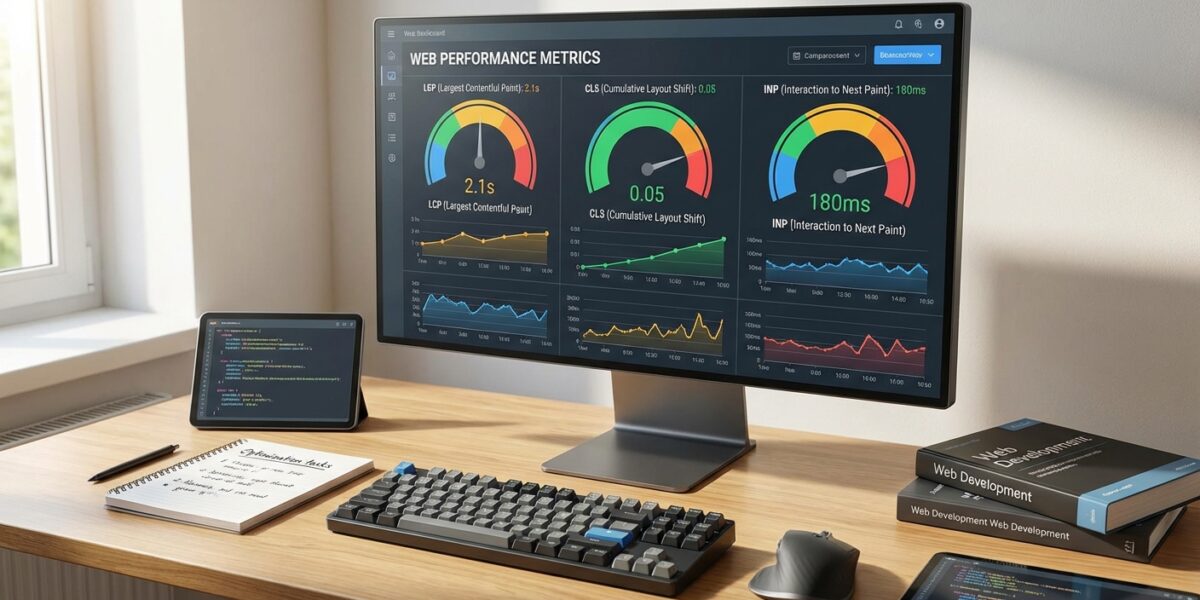
The three metrics are Largest Contentful Paint (LCP), Interaction to Next Paint (INP), and Cumulative Layout Shift (CLS). Each one targets a specific pain point that ruins user experience.
I’ve seen sites lose 30% of their organic traffic overnight because of poor Core Web Vitals scores. Conversely, I’ve helped clients recover and exceed previous traffic levels by systematically fixing these issues. linkgraph.com provides excellent advanced diagnostics for teams ready to go deeper.
The Three Metrics That Make or Break Your SEO
Largest Contentful Paint (LCP): The Loading Speed Reality Check
LCP measures how long it takes for the largest visible element on your page to load completely. This could be a hero image, a block of text, or a video. The goal is under 2.5 seconds, but here’s what most people miss: it’s not just about total page load time.
I recently audited a client’s e-commerce site where the homepage “felt” fast but had terrible LCP scores. The culprit? A massive, unoptimized hero image that took 4.2 seconds to render. We compressed it, added preload tags, and used WebP format. LCP dropped to 1.8 seconds, and conversion rates improved by 23%.
The key insight: LCP is about perceived loading speed, not technical loading speed. Users judge your site’s performance based on when they can see the main content, not when everything finishes loading.
Interaction to Next Paint (INP): The Responsiveness Game Changer
INP replaced First Input Delay (FID) in March 2024, and it’s a much tougher metric. While FID only measured the first interaction, INP tracks responsiveness throughout the entire page visit. You need to stay under 200ms for all interactions.
This is where many sites fail spectacularly. I’ve seen pages that load quickly but become unresponsive the moment users try to interact. Heavy JavaScript frameworks, poorly optimized event handlers, and blocking third-party scripts are the usual suspects.
One client had perfect LCP and CLS scores but terrible INP because their chat widget was blocking the main thread. We moved it to a web worker and saw INP improve from 450ms to 120ms. calibreapp.com offers excellent insights into measuring and improving these metrics.
Cumulative Layout Shift (CLS): Stop Making Your Users Dizzy
CLS measures visual stability—how much your page layout shifts unexpectedly during loading. Target score: under 0.1. This might seem minor, but layout shifts are infuriating for users and can destroy conversion rates.
The worst offenders are ads, embedded content, and images without defined dimensions. I worked with a news site where ads loading late caused massive layout shifts. Users would click on articles and end up clicking ads instead. We reserved space for ads and saw CLS drop from 0.4 to 0.06.
How to Actually Measure Core Web Vitals (The Right Way)
Most people make the mistake of only checking Google PageSpeed Insights and calling it done. That’s lab data—useful but not the complete picture. You need both lab and field data to understand what real users experience.
I use Google Search Console’s Core Web Vitals report as my starting point. It shows real user data (CrUX) for your actual traffic. Then I validate with PageSpeed Insights and dig deeper with Chrome DevTools for specific page analysis.
Here’s my diagnostic workflow: Start with Search Console to identify problematic page groups. Use PageSpeed Insights to get specific recommendations. Test with Chrome DevTools under realistic conditions (slow 3G, low-end devices). Monitor continuously with tools like moz.com for ongoing tracking.
The Lab vs. Field Data Reality
Lab data gives you controlled, repeatable results. Field data shows what actual users experience with their devices, network conditions, and browsing patterns. I’ve seen sites pass all lab tests but fail miserably in the real world because of slow mobile networks or older devices.
The key is using both. Lab data helps you diagnose and fix issues. Field data tells you if your fixes actually work for real users. This is similar to how I approach schema markup implementation—you need both technical correctness and real-world validation.
Optimization Strategies That Actually Work
LCP Optimization: Beyond Basic Image Compression
Everyone knows to compress images, but that’s just the beginning. Focus on Time to First Byte (TTFB) first—if your server is slow, nothing else matters. I target under 800ms for TTFB.
Preload your LCP element with <link rel="preload"> tags. Use critical CSS inlining for above-the-fold content. Eliminate render-blocking resources or defer them until after LCP. These technical optimizations often require developer involvement, but the impact is substantial.
INP Optimization: Taming JavaScript Chaos
INP problems usually stem from JavaScript blocking the main thread. Break up long tasks—yield control every 8-16ms. Debounce user input handlers to prevent overwhelming the browser. Move heavy computations to Web Workers when possible.
I recently helped a client optimize their product configurator. The original code processed every user input synchronously, causing 800ms delays. We implemented debouncing and moved calculations to a web worker. INP improved from 650ms to 140ms, and user engagement increased significantly.
CLS Optimization: Reserve Space for Everything
The golden rule: always specify dimensions for images, videos, and embeds. Use CSS aspect ratio boxes for responsive content. Reserve space for ads and dynamic content, even if it means showing placeholders initially.
Font loading causes major layout shifts. Use font-display: swap with size-adjusted fallbacks. Google Fonts now provides automatic fallback metrics, making this easier than ever.
Common Mistakes That Kill Your Scores
The biggest mistake I see is optimizing for PageSpeed Insights scores instead of real user experience. I’ve audited sites with perfect Lighthouse scores that performed terribly in Search Console because they only optimized for lab conditions.
Another common error is ignoring third-party scripts. That Facebook pixel, Google Analytics, or chat widget might seem harmless, but they often destroy your Core Web Vitals scores. Audit every third-party script and load them strategically.
WordPress sites face unique challenges. Heavy themes, excessive plugins, and shared hosting can tank your scores. I’ve seen 50% improvements just by switching to optimized hosting and cleaning up unnecessary plugins. wpengine.com provides excellent WordPress-specific optimization guidance.
The ROI of Core Web Vitals Optimization
Let me be direct: Core Web Vitals optimization isn’t just about SEO rankings—it’s about business results. I’ve tracked the impact across dozens of client sites, and the patterns are consistent.
Sites that improve from “poor” to “good” Core Web Vitals scores typically see 10-25% increases in organic traffic within 3-6 months. More importantly, conversion rates often improve by 15-30% because users have better experiences.
The investment pays off quickly. Most optimization work requires 20-40 hours of technical effort but delivers ongoing benefits. This is similar to the long-term value I’ve seen from E-E-A-T optimization—initial effort that compounds over time.
Prioritizing Your Optimization Efforts
Don’t try to fix everything at once. Start with your highest-traffic, highest-conversion pages. Use this formula: (Monthly Traffic × Conversion Rate × Average Order Value) × Improvement Percentage = Potential Revenue Impact.
Focus on pages that fail multiple metrics first. A page with poor LCP, INP, and CLS scores will see bigger improvements than one that only needs minor CLS adjustments.
Monitoring and Maintaining Your Scores
Core Web Vitals optimization isn’t a one-time project—it’s an ongoing process. New content, plugin updates, and third-party script changes can break your scores overnight.
I recommend monthly monitoring for most sites, weekly for high-traffic e-commerce. Set up alerts in Search Console and use automated monitoring tools. searchengineland.com provides comprehensive monitoring strategies.
Include Core Web Vitals checks in your deployment process. I’ve seen too many sites lose months of optimization work because a new plugin or theme update introduced performance regressions.
The future of technical SEO is moving toward user experience metrics like Core Web Vitals. Sites that master these fundamentals will have sustainable competitive advantages as Google continues emphasizing user experience in rankings.
Ready to optimize your Core Web Vitals? Start with a comprehensive audit of your highest-value pages, prioritize fixes based on business impact, and implement systematic monitoring. The investment in technical excellence pays dividends in both user satisfaction and search rankings.
Frequently Asked Questions
How long does it take to see Core Web Vitals improvements in search rankings?
Typically 4-8 weeks after Google processes the improvements through CrUX data. Field data updates monthly, so you’ll see lab improvements immediately but ranking impacts take longer as real user data accumulates.
Do Core Web Vitals matter more for mobile or desktop rankings?
Both matter, but mobile is critical since Google uses mobile-first indexing. Mobile Core Web Vitals often perform worse due to network and device constraints, making mobile optimization the priority.
Can poor Core Web Vitals completely tank my search rankings?
Core Web Vitals are a tiebreaker signal, not a primary ranking factor. Excellent content with poor Core Web Vitals will usually outrank poor content with perfect scores. However, in competitive niches with similar content quality, Core Web Vitals can be decisive.
What’s the biggest mistake people make when optimizing Core Web Vitals?
Focusing only on lab data (PageSpeed Insights) instead of real user data (Search Console). I’ve seen sites with perfect Lighthouse scores that fail in the real world because they didn’t test under realistic conditions with actual user devices and network speeds.